The legend allows you to turn the impacts and reports layers on and off, and to
refine your search by time, place, impact category, and report types. The Overlays
tab displays other useful boundaries.
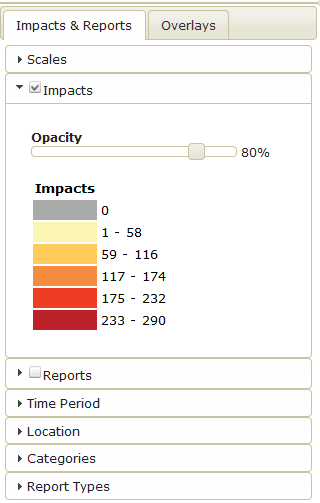
Use the triangles to the left of the legend headings to open and close each part of the legend.
Layers that are turned on and off with checkboxes refresh immediately. The options
that let you select a time period, state or county, one or more categories and one
or more report types aren’t applied until you click the Refresh button
at the top of the legend.
Use the opacity slider to make layers more transparent or more opaque.
Caution: Some options don’t work well together. For example, mapping reports
by affected area covers up the impacts.
Use the opacity slider to make layers more transparent or more opaque.
Use the triangles to the left of the legend headings to open and close each part of the legend.
Impacts and Reports each have their own layer on the Drought Impact
Reporter map. You can turn the layers on and off by using the checkboxes.
Scales
Use the Scale selection panel to toggle between scales.
National impacts are generally indirect economic effects of drought and affect all 50 states.
Multistate impacts apply to 2-49 states.
State impacts affect a single state.
County impacts describe drought’s effects on a specific county or group of counties.
City impacts describe drought’s effects on a municipality.
Impacts may have more than one affected area, so a single impact may show up at more than one scale.
Time Period
The default time window is the last 30 days. Open the time window selector on the
legend to choose a different interval. After you choose a new interval of time,
click the Refresh button at the top of the legend to apply your choice.
Choosing Custom brings up windows for start and end dates and a calendar
to select dates. The search will return information on any impact that occurs at
least partially within the specified window. For reports, if no specific start or
end date is given, the search uses the publication date instead.
If you customize the date, choose the year first.
To select a date in the distant past, select the earliest year visible on the dropdown list. Repeat until you are able to select the desired year. Each time you select a year, that year becomes the midpoint of the dropdown list.
Be sure to click on a specific date.
Location
Open the Location selector on the legend to choose a state. Click refresh in order to apply your choice and zoom to the state.
The display below the map will change to show counts and details for impacts and
reports for that state. Clicking on a county brings up details for that county in
a popup box, along with buttons that bring up impact details or return you to the
original view.
Categories
We categorize drought impacts and reports based on what sectors are involved. A
report or an impact can have more than one category. The Category bar on the legend
allows users to narrow their search to one or more categories. The colored icons
below the map change to reflect which categories were included in the search.
Agriculture
Drought effects associated with agriculture, farming, aquaculture, horticulture,
forestry or ranching. Examples of drought-induced agricultural impacts include damage
to crop quality; income loss for farmers due to reduced crop yields; reduced productivity
of cropland; insect infestation; plant disease; increased irrigation costs; cost
of new or supplemental water resource development (wells, dams, pipelines) for agriculture;
reduced productivity of rangeland; forced reduction of foundation stock; closure/limitation
of public lands to grazing; high cost or unavailability of water for livestock,
Christmas tree farms, forestry, raising domesticated horses, bees, fish, shellfish,
or horticulture.
Business & Industry
This category tracks drought's effects on non-agriculture and non-tourism
businesses, such as lawn care, recreational vehicles or gear dealers, and plant
nurseries. Typical impacts include reduction or loss of demand for goods or
services, reduction in employment, variation in number of calls for service,
late opening or early closure for the season, bankruptcy, permanent store
closure, and other economic impacts.
Energy
This category concerns drought's effects on power production, rates and revenue.
Examples include production changes for both hydropower and non-hydropower
providers, changes in electricity rates, revenue shortfalls and/or windfall
profits, and purchase of electricity when hydropower generation is down.
Fire
Drought often contributes to forest, range, rural, or urban fires, fire danger,
and burning restrictions. Specific impacts include enacting or easing burning
restrictions, fireworks bans, increased fire risk, occurrence of fire (number of
acres burned, number of wildfires compared to average, people displaced, etc.),
state of emergency during periods of high fire danger, closure of roads or land
due to fire occurrence or risk, and expenses to state and county governments of
paying firefighters overtime and paying equipment (helicopter) costs.
Plants & Wildlife
Drought effects associated with unmanaged plants and wildlife, both aquatic and
terrestrial, include loss of biodiversity of plants or wildlife; loss of trees
from rural or urban landscapes, shelterbelts, or wooded conservation areas;
reduction and degradation of fish and wildlife habitat; lack of feed and
drinking water; greater mortality due to increased contact with agricultural
producers, as animals seek food from farms and producers are less tolerant of
the intrusion; disease; increased vulnerability to predation (from species
concentrated near water); migration and concentration (loss of wildlife in some
areas and too much wildlife in others); increased stress on endangered species;
salinity levels affecting wildlife; wildlife encroaching into urban areas; and
loss of wetlands.
Relief, Response & Restrictions
This category refers to drought effects associated with disaster declarations,
aid programs, requests for disaster declaration or aid, water restrictions, or
fire restrictions. Examples include disaster declarations, aid programs, USDA
Secretarial disaster declarations, Small Business Association disaster
declarations, government relief and response programs, state-level water
shortage or water emergency declarations, county-level declarations, a declared
"state of emergency," requests for declarations or aid, non-profit
organization-based relief, water restrictions, fire restrictions, National
Weather Service Red Flag warnings, and declaration of drought watches or
warnings.
Society & Public Health
Drought effects associated with human, public and social health include
health-related problems related to reduced water quantity and/or quality, such
as increased concentration of contaminants; loss of human life (e.g., from heat
stress, suicide); increased respiratory ailments; increased disease caused by
wildlife concentrations; increased human disease caused by changes in insect
carrier populations; population migration (rural to urban areas, migrants into
the United States); loss of aesthetic values; change in daily activities
(non-recreational, like putting a bucket in the shower to catch water); elevated
stress levels; meetings to discuss drought; communities creating drought plans;
lawmakers altering penalties for violation of water restrictions; demand for
higher water rates; cultural/historical discoveries from low water levels;
prayer meetings; cancellation of fundraising events; cancellation/alteration of
festivals or holiday traditions; stockpiling water; public service announcements
and drought information websites; protests; and conflicts within the community
due to competition for water.
Tourism & Recreation
Drought effects associated with recreational activities and tourism include
closure of state hiking trails and hunting areas due to fire danger; water
access or navigation problems for recreation; bans on recreational activities;
reduced license, permit, or ticket sales (e.g. hunting, fishing, ski lifts,
etc.); losses related to curtailed activities (e.g. bird watching, hunting and
fishing, boating, etc.); reduced park visitation; and cancellation or
postponement of sporting events.
Water Supply & Quality
Drought effects associated with water supply and water quality include dry wells,
voluntary and mandatory water restrictions, changes in water rates, easing of
water restrictions, increases in requests for new well permits, changes in water
use due to water restrictions, greater water demand, decreases in water
allocation or allotments, installation or alteration of water pumps or water
intakes, changes to allowable water contaminants, water line damage or repairs
due to drought stress, drinking water turbidity, change in water color or odor,
declaration of drought watches or warnings, and mitigation activities.
Fruits & Nuts (orchard)
Drought effects related to orchard-grown fruits and nuts include the need for
increased irrigation; tree mortality; and reduced production of tree-grown
fruits and nuts such as coffee, papayas, coconuts, citrus, mangoes, macadamia
nuts, avocados, bananas, rambutan, loquat, lychee and jaboticaba.
Ornamentals
Drought effects related to ornamentals include the need for increased irrigation;
reduced revenue for flower and nursery crops; and reduced production of flowers
such as anthurium, orchids, ginger, pikake, pakalana, tuberose, protea and
maile.
Other Agriculture
Examples of drought-induced agricultural impacts include reduced planting
of sugar cane and corn; damage to crop quality; income loss for farmers due to
reduced crop yields; reduced productivity of cropland; insect infestation;
losses due to deer or other wildlife damaging fencing or irrigation systems or
eating forage; plant disease; increased irrigation costs; cost of new or
supplemental water resource development (wells, dams, pipelines) for
agriculture; forestry, raising domesticated horses, bees, fish, shellfish, or
horticulture; and increased corrosion of fencing due to lack of precipitation to
rinse off salt and vog deposits.
Produce (fruits and vegetables)
Drought effects related to produce, i.e., fruits and vegetables, include
increased irrigation, and reduced yield on crops such as taro, pineapple,
cabbage, lettuce and broccoli.
Ranching
Drought effects related to ranching or dairy include reduced productivity of
rangeland; supplemental feeding; forced reduction of foundation stock;
closure/limitation of public lands to grazing; early weaning and lowered weaning
weights of calves; high cost or unavailability of water for livestock; and the
cost of hauling water for livestock.
General Awareness
General Awareness applies only to media reports and usually indicates that people
are concerned about drought but no specific impact has occurred yet or the information
is too general to use for an impact.
Additional Descriptors
The state icon means that the
affected area of an impact or a report is statewide and is mapped to all the counties in a particular state.
The “thumbs up” icon
means that a report or impact has been identified as a positive result of drought,
such as fewer construction delays due to rain. The Advanced Search page allows users
to restrict searches to positive impacts. Positive impacts are rare. As of September
2011, only 36 out of more than 13,000 impacts were positive.